Scan and Analyze Sui Data with Space and Time
In this blog, we’ll explore how to use Space and Time’s data indexing to efficiently scan and analyze Sui data. We'll dive into the SXT Studio, which enables you to analyze and access data on the Sui network with ease. Whether you're a developer, researcher, or an enthusiast, this guide will help you get started with using SXT to make the most of Sui data.
An Intro to the Sui Network
The Sui network is a Layer 1 blockchain designed to deliver high throughput and low latency using a unique object-centric data model. Unlike account-based blockchains, Sui structures data as programmable objects, enabling parallel transaction execution and fast scalability.
Its native token, SUI, powers gas fees, staking, and governance. The Sui ecosystem has been expanding rapidly, with wallets, dapps, and developer tools driving adoption across DeFi, gaming, and NFTs.
Space and Time indexes Sui data, so SXT keeps a real-time copy of the blockchain in a queryable format and makes it available for analysis
Now, let’s explore how we can access Sui data using the Space and Time engine.
Inside the Sui Blockchain Architecture
The Sui blockchain uses a highly parallelized execution model where independent transactions can be processed simultaneously, giving it speed and efficiency. Its consensus mechanism, Narwhal and Bullshark, is designed for fast finality and security.
Developers interact with the chain using Sui RPC endpoints and the Move programming language for smart contract development. This foundation allows dapps on Sui to benefit from low fees, fast performance, and innovative use cases across DeFi and beyond.
Analyze and scan Sui data using Queries
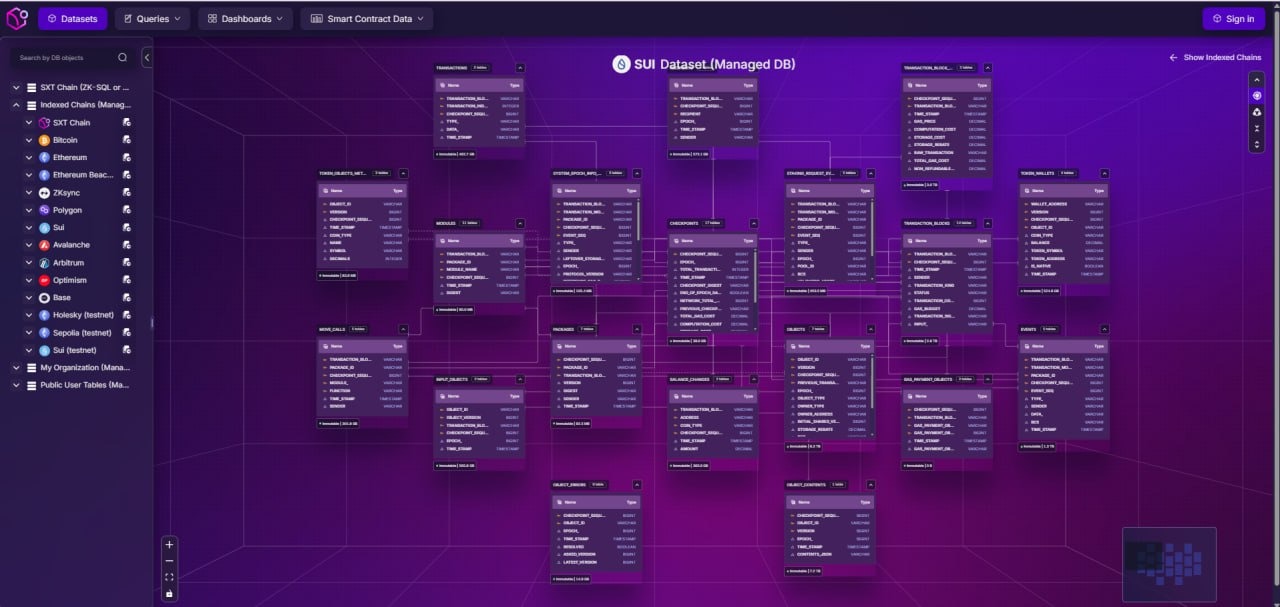
Getting a visual representation of all the indexed SUI data is extremely easy. Just follow these two simple steps:
- Navigate to the "Datasets" option in the main menu
- Click on "SUI" Dataset.
With SXT, analyzing Sui wallets or contract activity doesn’t require developer skills. The platform automatically indexes Sui data and makes it available in a queryable format, which means you can explore the data using either standard SQL or simple natural language queries. This means you can simply ask a question, and SXT converts it into SQL automatically.
For example, if you want to check which Sui wallets hold the largest balances, or which addresses interact most frequently with a contract, you can do this directly in the Studio.
Steps to run a query:
1. Log into the Studio
2. Navigate to the Query Editor under the “Queries” tab
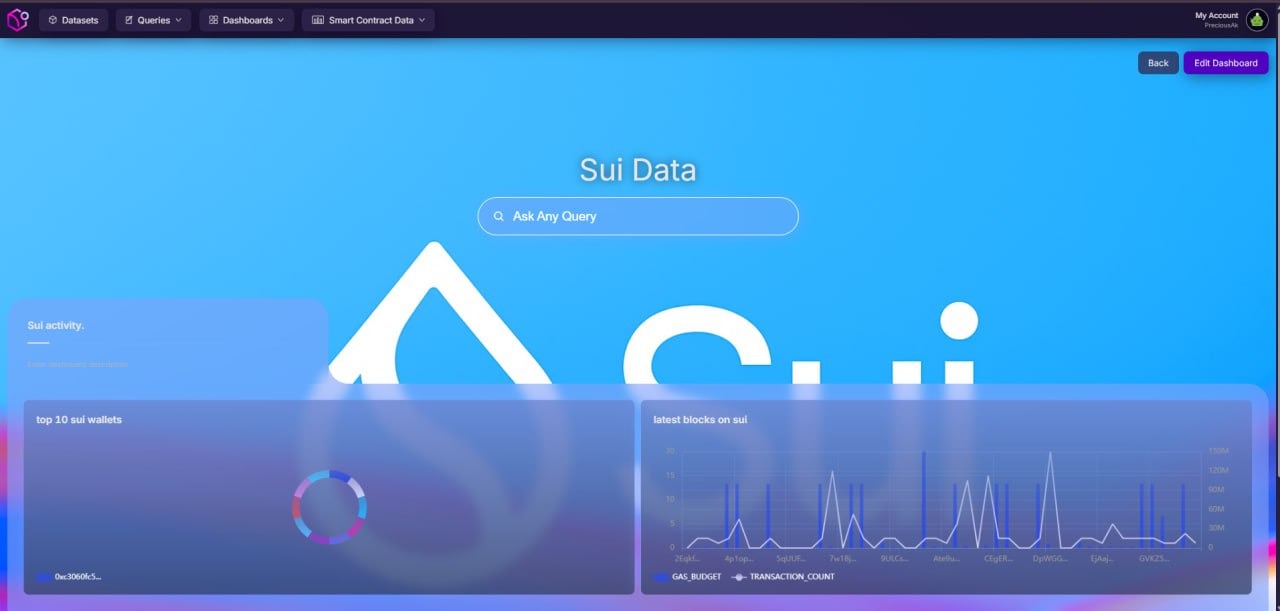
3. Run a natural language query such as:
“Show me the top 10 Sui wallets with the highest balances” as seen below;

Or:
“Show me the Sui wallets that interacted most with contracts in the last 7 days”

This makes indexed Sui data easy to scan, even for non-technical users.
Track the Sui Bridge and Cross-Chain Activity
The Sui bridge connects the Sui blockchain to other networks, allowing users to move assets in and out of the ecosystem. Tracking Sui bridged activity provides insights into liquidity flows, cross-chain usage, and adoption across multiple ecosystems. With Space and Time, you can analyze deposits, withdrawals, and token transfers across the bridge. Developers and researchers can also compare Sui bridged vs Sui native activity to understand user behavior across chains.
For example, you can run a query like:
“Show me the recent blocks on SUI”

This helps track cross-chain adoption and provides deeper insight into how assets flow in and out of the Sui network.
Visualizing Queries
Analyzing Sui activity helps reveal trends in liquidity and trading volume across DeFi protocols on Sui. Using SXT Studio, you can visualize sui activity in just a few steps.
Steps to visualize Sui activity:
1. Run a query on swap transactions in the Query Editor
2. Switch to the Query Visualization tab
3. Save the chart and track Sui activity over time.
By combining multiple charts, you can build a complete picture of Sui crypto usage. Leveraging indexed Sui data, researchers and developers gain access to insights that reveal adoption patterns, trading behavior, and liquidity trends across the network.
Build a Custom Sui Blockchain Explorer
By now, you’ve seen how to visualize indexed SUI data, analyze wallet activity, and run natural language queries to explore the network. Space and Time combines all of this into a powerful tool for building your own custom SUI explorer, fully aligned with your specific needs. Whether you're tracking wallet movements, scanning smart contracts, or monitoring transaction activity, SXT provides access to real-time SUI data in a structured and searchable format.
For example, you can run queries like:
Show transaction volume on SUI in the last 24 hours.
Identify most active smart contracts on SUI by unique users.
These examples help you uncover usage trends, highlight key contracts, and monitor network performance.
With SXT Studio, you’re free to create a fully customized explorer experience that supports your app, your analytics, or your community.
Steps to build an explorer in SXT:
1. Log into the Studio
2. Navigate to the New Dashboard under the “Dashboards” tab
3. Add visualizations from your saved queries
4. Customize the layout and click “Save”
This gives you a personalized explorer built on indexed Sui data, allowing you to track the Sui blockchain with precision.
Click here to start querying Sui blockchain data for free
By providing fast and cost-effective access to onchain data, SXT empowers you with the best tools to monitor the Sui network. Whether you’re analyzing transaction trends, exploring swap volume, or indexing your own smart contracts, Space and Time makes it simple to transform Sui data into actionable insights.
Sui is one of many chains we index. See the full list in our blockchain indexing tools guide.
